1. ClickBench Performance Test Results
ClickBench is the official performance benchmarking list for ClickHouse. All 43 SQL queries in the list are single-table queries, with a focus on the performance of aggregation queries under different dimension combinations and cardinality set sizes in single-table queries.
The team developed a ClickHouse CBO (Cost-Based Optimizer) and transformed the execution architecture from Scatter-Gather to Full-MPP (Massively Parallel Processing). In a test cluster with 10 nodes(32C/96G/2T), the time to complete a run of the benchmark decreased from 28.3 seconds to 22.6 seconds. The following testing is based on this commit.
The chart below shows the time for each query in the ClickBench benchmark. The tests are divided into two groups: one with the new execution framework enabled and the other without it. Each group was run three times.

The table below shows the test results under different concurrency levels. Using the ClickBench benchmark, the average time to complete the benchmark was tested under 1, 2, 4, 8, and 12 concurrent levels, with the time measured in seconds.
| Concurrent levels | 1 | 2 | 4 | 8 | 12 |
| ClickHouse 2.10 | 33 | 19 | 16 | 17 | 13 |
| ClickHouse 2.10 (With the new execution framewrok) | 25 | 14 | 8 | 8 | 9 |
Here, we analyze the queries with significant performance improvements to reveal how the optimizer and MPP execution framework enhances query performance.
Please note that the CBO optimizer and MPP execution framework will be referred to as the new execution framework in the following text.
2. Single-Stage vs. Two-Stage Aggregation
Let’s analyze the 5th SQL in ClickBench. After enabling the new execution framework, the query time is one-second of the time when the new execution framework is not enabled. The SQL is as follows:
SELECT COUNT(DISTINCT UserID) FROM hits;2.1 Query Plan
The native ClickHouse query plan is as follows:
   ┌─explain────────────────────────────────────────────────────────────────────────────┐
1. │ Expression ((Project names + Projection))                                          │
2. │   MergingAggregated                                                                │
3. │     Union                                                                          │
4. │       Aggregating                                                                  │
5. │         Expression ((Before GROUP BY + Change column names to column identifiers)) │
6. │           ReadFromMergeTree (default.hits_local)                                   │
7. │       ReadFromRemote (Read from remote replica)                                    │
   └────────────────────────────────────────────────────────────────────────────────────┘
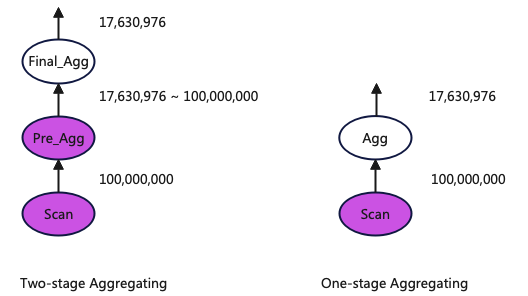
The diagram below visually presents the query plan. Please note that to make the diagram clearer, the interference from the Expression operators has been ignored. The operators in purple are executed on all nodes, while the operators in white are executed only on the node that initially receives the user’s query.

The query plan with the new execution framework enabled is as follows:
   ┌─explain──────────────────────────────────────────────────────────────────────────┐
1. │ Expression ((Project names + Projection))                                        │
2. │   Aggregating                                                                    │
3. │     ExchangeData (distributed by Singleton, sorted by None)                      │
4. │       Expression ((Before GROUP BY + Change column names to column identifiers)) │
5. │         ReadFromMergeTree (default.hits_local)                                   │
   └──────────────────────────────────────────────────────────────────────────────────┘
The diagram below visually presents the query plan. As before, some interfering operators have been ignored for clarity. Similarly, the operators in purple are executed on all nodes, while the operators in white are executed only on the node that initially receives the user’s query.

It can be seen that the query plan with the new execution framework enabled uses a single-stage aggregation operator, whereas the query plan without the new execution framework uses a two-stage aggregation operator.
2.2 Query Plan Analysis
A simple explanation of single-stage aggregation and two-stage aggregation:
- The aggregation operation of a single-stage aggregation operator is performed only on the node that initially receives the user’s query.
- In contrast, a two-stage aggregation operator first performs preliminary aggregation on all nodes, then sends the preliminarily aggregated query results to the initial node for secondary aggregation.
Compared to two-stage aggregation, single-stage aggregation skips the execution of data pre-aggregation (Pre_Agg), but the amount of data input for the final aggregation is larger.
The diagram below shows the data output volume of each operator in both aggregation methods (the data output volume of each operator is also the amount of data that the downstream operator needs to process). The hits table contains 100 million rows, so the Scan outputs 100 million rows. The final result is 17,630,976, so both Final_Agg and Agg output 17,630,976 rows, and the data output by Pre_Agg falls between these two values.

From this data output relationship, it can be seen that the cardinality set of UserID is very large, and the reduction in data after Pre_Agg aggregation is not significant. Therefore, in this case, single-stage aggregation is more optimal.
3. Shuffle vs. Singleton Aggregation
Let’s analyze the 35th SQL query. After enabling the new execution framework, the execution time is 3 seconds, compared to 4 seconds before enabling it, resulting in a 33% reduction in execution time. The SQL is as follows:
SELECT 1, URL, COUNT(*) AS c FROM hits GROUP BY 1, URL ORDER BY c DESC LIMIT 10;3.1 Query Plan
The query plan without the new execution framework enabled is as follows:
    ┌─explain──────────────────────────────────────────────────────────────────────────────────┐
 1. │ Expression (Project names)                                                               │
 2. │   Limit (preliminary LIMIT (without OFFSET))                                             │
 3. │     Sorting (Sorting for ORDER BY)                                                       │
 4. │       Expression ((Before ORDER BY + Projection))                                        │
 5. │         MergingAggregated                                                                │
 6. │           Union                                                                          │
 7. │             Aggregating                                                                  │
 8. │               Expression ((Before GROUP BY + Change column names to column identifiers)) │
 9. │                 ReadFromMergeTree (default.hits_local)                                   │
10. │             ReadFromRemote (Read from remote replica)                                    │
    └──────────────────────────────────────────────────────────────────────────────────────────┘
The query plan with the new execution framework enabled is as follows:
┌─explain────────────────────────────────────────────────────────────────────────────────────┐
 1. │ Expression (Project names)                                                                 │
 2. │   TopN (Final)                                                                             │
 3. │     ExchangeData (distributed by Singleton, sorted by Stream(count()))                     │
 4. │       TopN (Preliminary)                                                                   │
 5. │         Expression ((Before ORDER BY + Projection))                                        │
 6. │           MergingAggregated                                                                │
 7. │             ExchangeData (distributed by Hashed, sorted by None)                           │
 8. │               Aggregating                                                                  │
 9. │                 Expression ((Before GROUP BY + Change column names to column identifiers)) │
10. │                   ReadFromMergeTree (default.hits_local)                                   │
    └────────────────────────────────────────────────────────────────────────────────────────────┘
3.2 Query Plan Analysis
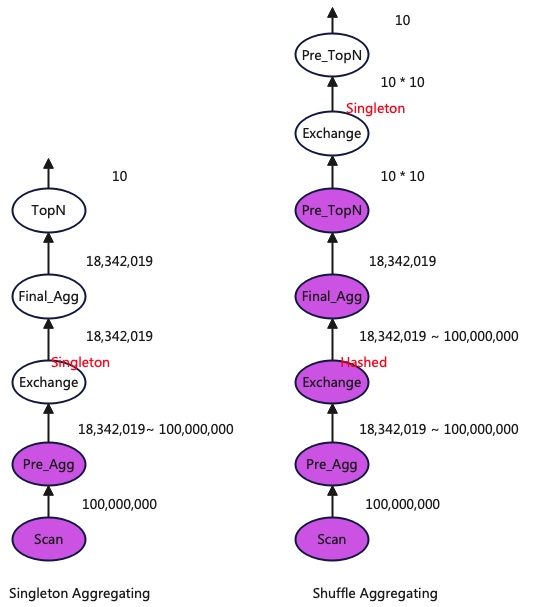
It can be observed that both query plans are two-stage, but the difference is that with the new execution framework enabled, a shuffle aggregation method is used, whereas without the new execution framework, a singleton aggregation method is used.
First, a brief explanation of singleton and shuffle aggregation, both of which are two-stage aggregation methods. The difference is:
- Singleton Aggregation: The second stage, Final_Agg, is executed on a single node, so the downstream Pre_Agg needs to send data to just one node.
- Shuffle Aggregation: The second stage, Final_Agg, is executed on all nodes, so the downstream Pre_Agg needs to send data to the corresponding nodes based on the aggregation keys, which are distributed across all nodes in the cluster.
Advantages and Disadvantages of Shuffle and Singleton Aggregation:
- Singleton Aggregation:
- Advantage: Less data transmission is required.
- Disadvantage: Final_Agg can only be executed on a single node, and consequently, subsequent TopN operations can only be performed on one node.
- Shuffle Aggregation:
- Advantage: Final_Agg along with Pre_TopN can be executed on multiple nodes.
- Disadvantage: It involves additional data transmission.

The diagram above shows a comparison of the two query plans, including the data output volume of each operator. The data volume output by Final_Agg is obtained from the SQL with the limit and orderby clauses removed. It can be concluded that when the data volume output by Pre_Agg is relatively large, using the Shuffle aggregation method is more optimal.
3.3 Limitations of Native ClickHouse
Native ClickHouse does not support the Shuffle aggregation method.
3.4 Peek Memory Usage
After adopting the Shuffle aggregation method, the peak memory usage of the query decreased from 2.52GB to 1.56GB.
# Singleton Aggregating:
10 rows in set. Elapsed: 4.053 sec. Processed 100.00 million rows, 9.94 GB (24.67 million rows/s., 2.45 GB/s.)
Peak memory usage: 2.52 GiB.

# Shuffle Aggregating:
10 rows in set. Elapsed: 2.751 sec. Processed 100.00 million rows, 9.94 GB (36.35 million rows/s., 3.61 GB/s.)
Peak memory usage: 1.56 GiB.
4.More Aggregation Execution Methods
There are also the following two aggregation methods that have not yet been implemented:
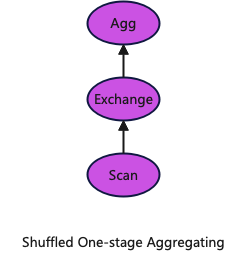
1.Single-stage Shuffle Aggregation
The operator downstream of Agg directly shuffles the data according to the aggregation keys, distributing it to all nodes in the cluster, and then performs aggregation.

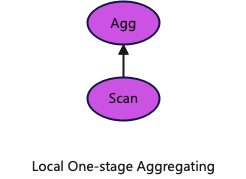
2.Local Single-Stage Aggregation
If the data in the table is hashed across the cluster according to the aggregation keys of the query, then each node can directly perform aggregation locally to generate part of the final result. In the query plan, the Exchange operator in the single-stage shuffle aggregation can be directly omitted.

5. Summary
This article reveals the secrets behind the performance improvements of the execution framework in single-table aggregation query scenarios. The new execution framework version introduces two new aggregation execution operator methods:
- Single-stage aggregation
- Two-stage shuffle aggregation
In the ClickBench benchmark, most queries that showed performance improvements did so because they adopted the two-stage shuffle aggregation method. Therefore, in most scenarios within the ClickBench test set, the two-stage shuffle aggregation method is more optimal compared to ClickHouse’s native singleton two-stage aggregation method.
Testing reveals that Doris(2.1) and ClickHouse with the new execution framework have the same execution plan, but Doris performs better. Analysis suggests that this might be because the Exchange operator in Doris is asynchronous on both the sending and receiving ends, whereas in ClickHouse’s new execution framework, it is synchronous. This hypothesis awaits POC (Proof of Concept) verification.
This work is licensed under a Creative Commons Attribution 4.0 International License. When redistributing, please include the original link.