Occasionally, the ClickHouse process is killed by the operating system’s OOM (Out Of Memory) Killer. The investigation into the issue is as follows. The container running ClickHouse has a memory size of 64GB, and the maximum memory usage for the ClickHouse process (max_server_memory_usage) is set to 54GB. In theory, this should prevent OOM from occurring.

There are two questions here:
- Why did max_server_memory_usage not take effect?
- Can ClickHouse’s memory management mechanism,
MemoryTracker, track all memory usage?
Memory Management Mechanism
ClickHouse’s memory management is mainly reflected in two aspects: tracking and limiting. The tracking dimensions include thread, query, user, and process. These statistics help administrators and users understand memory usage. Additionally, ClickHouse provides parameters to limit memory usage, such as max_memory_usage, max_memory_usage_for_all_queries, and max_server_memory_usage. ClickHouse’s memory tracking and limiting are based on the MemoryTracker mechanism. So, how is memory tracking implemented?
MemoryTracker
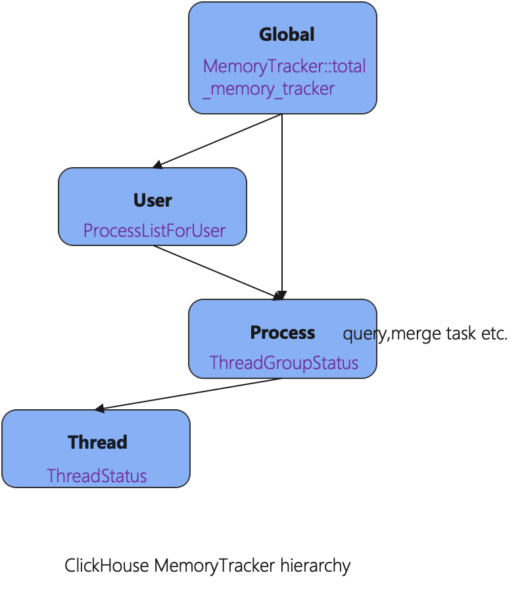
The granularity of ClickHouse memory tracking, from smallest to largest, includes four levels: Thread, Process (Query, merge task), User, and Global. The smallest granularity tracked is the thread. Multiple threads form a ThreadGroup, which serves a Query or background tasks such as merge tasks. A Query can belong to a specific user, while background tasks do not have a user association. Each MemoryTracker has a parent, forming an overall tree structure. When a MemoryTracker is updated, it simultaneously updates its parent. The system has a global MemoryTracker, total_memory_tracker, which is the root of all MemoryTrackers and thus can track the memory of the entire process. The relationship between each level’s MemoryTracker and the corresponding tracking class is shown in the following diagram:

Small block memory tracking
ClickHouse overrides the C++ new and delete operators. This means that all memory allocations and deallocations made using new and delete within the process are tracked. For reference, see: src/Common/new_delete.cpp.
void * operator new(std::size_t size)
{
    Memory::trackMemory(size);
    return Memory::newImpl(size);
}

void operator delete(void * ptr) noexcept
{
    Memory::untrackMemory(ptr);
    Memory::deleteImpl(ptr);
}

...
Memory allocation and deallocation are very frequent operations. If memory statistics were updated with every new and delete, it would significantly waste performance. To address this, ClickHouse has implemented several optimizations:
- Each thread maintains a variable that continuously accumulates memory changes over a certain period. When the memory change exceeds a threshold (e.g., [-4M, 4M]), it updates the thread’s memory statistics and also updates its parent and higher-level statistics. This can be referenced in
ThreadStatus::untracked_memory_limit. - During statistics collection, some coding optimizations are used. For example,
unlikelyandlikelyare used to optimize branch prediction accuracy, thereby increasing CPU instruction pipeline efficiency.
Large block memory tracking
For tracking large memory allocations, ClickHouse implements a custom Allocator. You can refer to src/Common/Allocator.h for details. This custom Allocator is used in various scenarios such as PODArray, Arena, and hash tables.
/// Allocate memory range.
    void * alloc(size_t size, size_t alignment = 0)
    {
        checkSize(size);
        CurrentMemoryTracker::alloc(size);
        return allocNoTrack(size, alignment);
    }

    /// Free memory range.
    void free(void * buf, size_t size)
    {
        checkSize(size);
        freeNoTrack(buf, size);
        CurrentMemoryTracker::free(size);
    }
Scope of Memory Tracking
This method of memory tracking can cover the vast majority of memory usage, but there are some scenarios where it does not apply. Below are the coverage areas for the two types of memory tracking:
- Memory Allocated and Deallocated via
new/delete(typically small blocks):- This includes memory managed by ClickHouse itself and third-party libraries.
- All such memory can be fully tracked.
- Memory not Allocated via
new/delete(typically large blocks):- This covers scenarios within ClickHouse itself.
- However, it does not cover scenarios within third-party libraries.
For scenarios that cannot be covered, there may be discrepancies in memory parameters, which can lead to inaccuracies in certain memory limit parameters, such as max_server_memory_usage.
Correction for Total Memory Usage by the Process (Root MemoryTracker)
To address the potential discrepancies in the total memory usage statistics (root MemoryTracker), ClickHouse employs a periodic correction mechanism. Using AsynchronousMetrics, the actual memory usage of the process is corrected every minute. The correction logic is as follows:
// AsynchronousMetrics::update

        MemoryStatisticsOS::Data data = memory_stat.get();

        new_values["MemoryVirtual"] = data.virt;

        new_values["MemoryResident"] = data.resident;

        new_values["MemoryShared"] = data.shared;

        new_values["MemoryCode"] = data.code;

        new_values["MemoryDataAndStack"] = data.data_and_stack;

        {

            Int64 amount = total_memory_tracker.get();

            Int64 peak = total_memory_tracker.getPeak();

            Int64 new_amount = data.resident;

            total_memory_tracker.set(new_amount); // 内存修正

            CurrentMetrics::set(CurrentMetrics::MemoryTracking, new_amount);

        }
The above figure shows the difference between the memory statistics tracked by MemoryTracker and the actual memory size during the correction process in a production environment. From this, we can see that there is a statistical deviation. When max_server_memory_usage is set to 52GB, the memory deviation can be as large as 14GB. Therefore, even if max_server_memory_usage is configured, the following situations may occur:
- The memory has not reached the
max_server_memory_usagelimit, but the memory is exceeded, resulting in the OS OOM killer terminating the process. - The memory has reached the
max_server_memory_usagelimit, but the actual memory usage is not that high.
Conclusion
The hierarchical MemoryTracker model can effectively track memory usage at four levels: thread, query, user, and process. However, due to deficiencies in the statistical mechanism, some deviations in the statistics may occur, leading to potential inaccuracies in certain memory limit parameters. To address this, ClickHouse performs periodic corrections, which ensures that overall memory control remains effective.
This work is licensed under a Creative Commons Attribution 4.0 International License. When redistributing, please include the original link.